DubHacks 2025
In this blog post, I'm going to describe my experience at DubHacks 2025 in Seattle. The content is intended for technical readers, but anyone should be able to get an idea of what I did by reading the beginning and the end and skimming through the images.
The finite nature of my college career compels me to take what opportunities I can. That's why one Saturday afternoon in October, I found myself at the University of Washington in Seattle for DubHacks, along with my friends Danial, Lukas, and Renn.
The hardest part of a hackathon is coming up with a good idea. With a strong idea, coding starts when the hackathon starts; the only challenge is the project itself. Conversely, if you don't know exactly what you're making, you'll waste hacking time trying to figure that out, only to eventually settle for a mediocre idea so that there's enough time to implement it. All four of us have been there before. This time, we knew better. By the time we rendezvoused on the UW campus, we'd already been planning our project for more than a week.
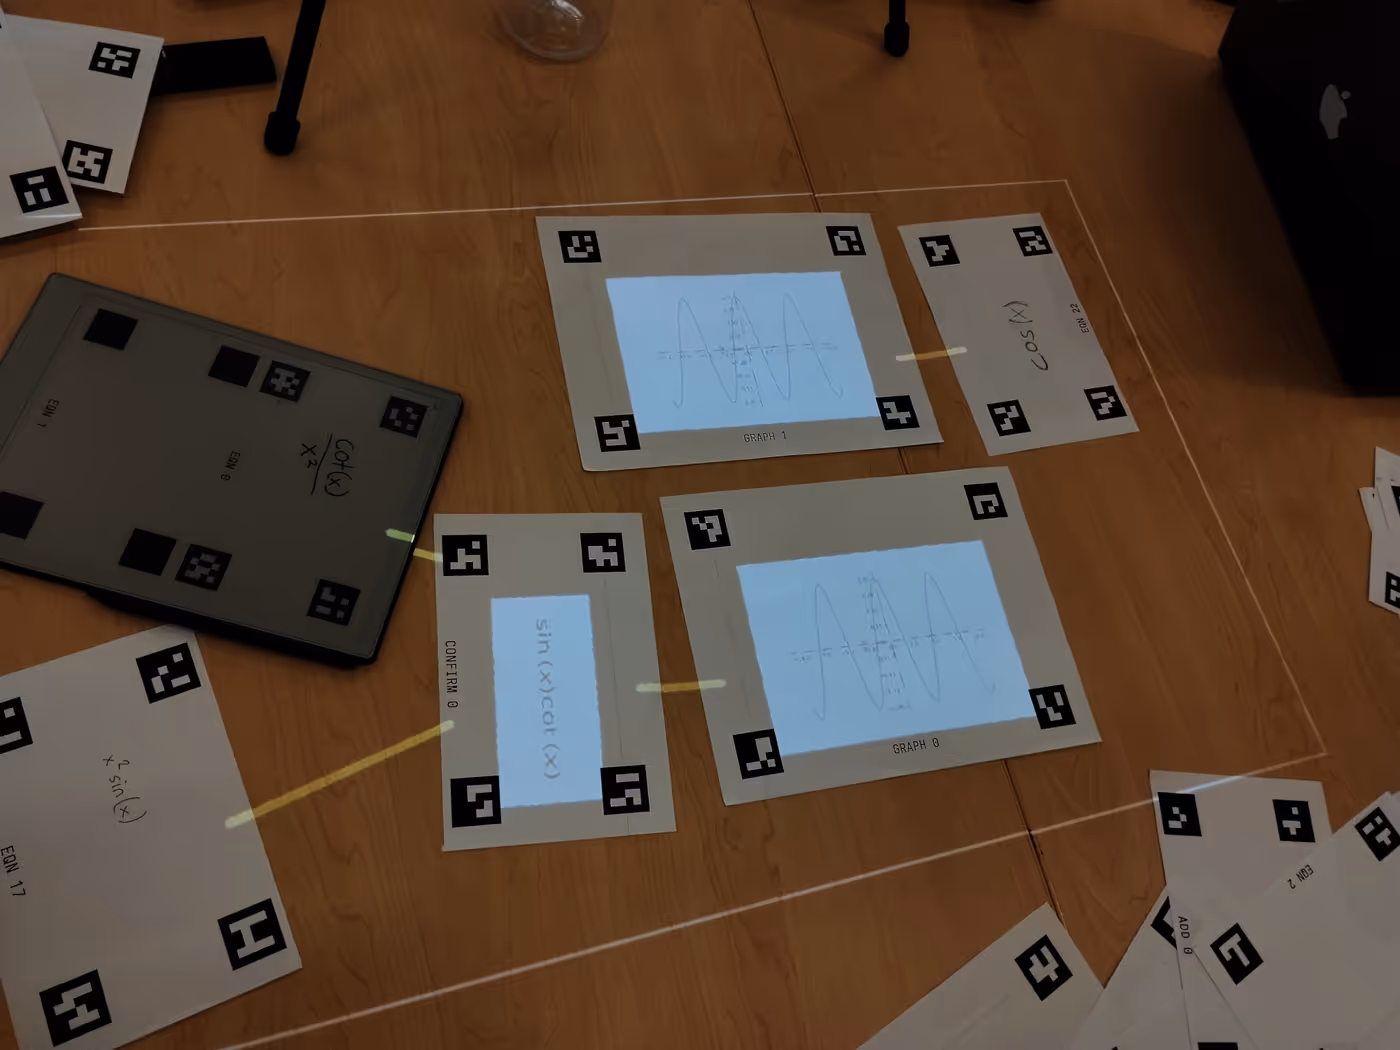
We were hooked by a concept called Dynamicland. If you don't have time to watch the linked video, the idea is to combine computer vision with a projector to transform everyday objects into interactive interfaces. We decided to manifest the concept by making a tabletop version of Desmos where users write mathematical equations on paper and the graphs of those equations are projected alongside.
We decided to designate pieces of paper as different classes, each with its own purpose:
- equation cards for users to write on and for the camera to scan
- graph cards for the equations to be graphed on
- addition cards that add two equations
- multiplication cards that multiply two equations
Prioritizing ease of implementation over elegance, as one should always do at a hackathon, we agreed that the best way to track the location of physical cards would be to print a visual identifier on each corner which contained information like card type and corner alignment (e.g. equation card in the top left). We accomplished this with ArUco markers. Each marker is generated from a number. OpenCV can analyze any marker and identify that number.
We reserved ranges of integers for each type:
- 0–199 were graph cards
- 200–399 were equation cards
- 400–599 were addition cards
- 600–799 were multiplication cards
This graph card is a good example.

- The top left tag corresponds to the number 0.
- The top right tag corresponds to the number 1.
- The bottom left tag corresponds to the number 2.
- The bottom left tag corresponds to the number 3.
With this simple specification, we can look at one tag and instantly know what type of card it refers to and which corner it is without having to do any computation. This is information for projecting an image onto a card.
Generating a PDF with Typst
We needed about 30 cards like the one above, and as software engineers, we certainly weren't about to make each one by hand. This was a great use case for Typst. It's like LaTeX but if it was an actual programming language with sensible defaults instead of a morass of macro expansions that somehow works. I've been using it for some time, and I was excited to work with it again.
First, I ran a Python script, written by Renn, that generated 1000 unique tags and outputted them as cardinally numbered square images. Then, I made a Typst object defining metadata for each card type:
#let metadata = (
  (
    name: "graph",
    offset: 0, // what number to start the tags at
    flipped: true, // if false, print two tags per page instead of one
  ),
  (
    name: "eqn",
    offset: 200,
    flipped: false,
  ),
  // ...
)
Then, I wrote a function called single which takes in one of the objects
stored in metadata and draws a label and the four tags, automatically
numbered according to the schema.
#let alignments = (
  top + left,
  top + right,
  bottom + left,
  bottom + right,
)

#let single(data, num) = {
    for i in range(4) {
      place(
        alignments.at(i),
        image(
          "markers/marker-" + (data.offset + (num * 4) + i) + ".png",
          width: 3cm,
        ),
      )
    }
    place(bottom + center)[#upper(data.name) #num]
}
After that, all I had to do was loop through the metadata and call single a
few times for each object. Without Typst, I would've had to write a Python
script which generated LaTeX code and then compiled it. It was much more
elegant to programmatically describe document content directly.
It was great fun to create the PDF, but I wasn't done yet. We needed to print it out on paper for our project idea to work, and only University of Washington students could access the campus printers. That's right; the only way to finish this job was to interact with another human being. (Oh no! The horror!) Thankfully, I am much more confident and comfortable with this sort of thing than I was my freshman year, and the first UW student I talked to kindly agreed to print our sheets for us.
More progress
We braved the endless Seattle rain to get dinner—pizza and donuts—and divided the remaining work amongst ourselves. Danial prompt engineered Gemini to analyze an image of a handwritten equation and output its representation in the syntax of SymPy, a library that can represent and graph algebraic expressions. Renn wrote code that translated the camera view to the projector view so that the projector's output lined up exactly with the physical cards. With that foundation in place, he and I worked together to find a card's bounding box using its four tags and to draw that box on the card in real time. This alone was pretty neat once we got it working!
SymPy can generate the graph of an equation, but it's designed for research, so
by default it writes the graph to an image file. This is not ideal because
we're dealing with real-time graphing, and it's slow to read a file every
frame. Was there a way to store the image in memory instead? By inspecting the
source code, Lukas and I discovered the tremendously intuitive chain of
properties and methods that was plot().fig.canvas.buffer_rgba().to_bytes(),
with some other calls in between that I omitted for simplicity.
For some reason, this worked on my computer, but it crashed on Lukas's. After thinking awhile, I realized on his high density display, one logical pixel has a width of two physical pixels, distorting the number of RGBA values by a factor of 4. I compensated for this factor and stored it in an environment variable so it could be configured per-device.
Ironically, image-from-bytes rendering was not straightforward; we found ourselves unable to make it render anything but strange ghost-like squiggles. We compromised by writing to a file and reading from disk every frame anyway. With a modern SSD, our demo ran at around 10 frames per second, and that was fast enough. In fact, I don't think we were I/O-bottlenecked. This decision was thematic of the whole process. We spent our time very strategically, only bothering with features that would matter in our demo.
Design decisions
Our initial implementation made a call to the Gemini API every frame, a questionable solution considering the Gemini API limits users to a certain number of queries per unit time. I cached this result to improve the speed and efficiency of our program. This was a good start, but it brought up a larger decision.
We had an interesting choice to make concerning Gemini usage. How do we minimize the number of expensive calls to Gemini while also ensuring that an equation card is re-analyzed if physically updated? Do we try to remember a card indefinitely after scanning it the first time?
We decided to process an equation card if its four corners were not visible in the previous frame. Since people tend to cover one of the corners when they write something on the card, this was a natural time to refresh Gemini's view. It also meant that if Gemini did not correctly parse the output, we could force it to try again by waving our hand in front of the equation.
Further progress
To reach functionality as quickly as possible, we had been drawing a placeholder image onto the graph cards. Our coolest moment was the first time we actually drew a graph dynamically generated from a handwritten equation.

This was very late in the night, but that didn't slow Renn. He implemented add and multiply cards that could operate on an arbitrary number of equations and redirect the result to a graph card. He made invalid functions fail gracefully and indicated their state with a red color. During this time, we also improved the reliability of our demo, fixing bugs and addressing major performance issues.
During sunrise at previous hackathons, I've been frantically scrambling to finish everything in time. This morning, though, we'd already implemented everything we wanted by sunrise. We spent the remaining time playing with our project, exploring what to show the judges when the time came. This was really helpful; when we began, we had no idea what our presentation should look like, but by the time we finished, each team member knew exactly what to discuss and which features to showcase.
Around this time, a judge stopped by to informally check out our project. He was super cool and lent us his personal markers for our demos! These were tremendously useful, as Gemini parsed markers more reliably than pens and pencils.
Strangely, we discovered that our project, though written entirely in Python, had a memory leak. After running a few minutes, it would start to consume tens of gigabytes of RAM. We solved one leaks by "closing" matplotlib plots after grabbing their output, but it was clear that other leaks remained. However, this didn't get in the way of our demos; we just restarted the application occasionally.
Judging
Judging was delayed significantly. I have been to seven hackathons, and I don't think judging has been on time for even one of them. I spent half the extra time catching up on sleep and the other half walking around the UW campus with Danial.
When the judges finally came, they were impressed by the real-time projected graphics and the equation parsing capability. Everyone on our team did a great job explaining our project enthusiastically while also leaving room for teammates to speak up.
One technical oversight was our decision to store equations in a hashtable. At the time it did not occur to us that because hashtable keys are unique, we could not represent multiple instances of the same equation. One of our judges, a QA engineer, tried the equation 1+1, which obviously failed under this system. Oops!
When the last judge arrived, the equation parser suddenly marked all equations as invalid. We blamed this on the Gemini API rate limit. Thankfully, we had recorded a video the night before, so we were able to show the judge an earlier version of our working project. He was quite understanding, still finding interesting questions based on what he saw.
After that judge left, we loaded another API key, only to find that the equation parsing still wasn't working; something else was triggering the issue. Whatever the cause, we were very lucky it didn't happen until judging was almost over.
I didn't see any other teams with a projector. Throughout the whole hackathon, it had drawn eyes and questions, and it didn't stop during judging. Many extra judges came by to evaluate our project. The tripod setup piqued their interest, and the physical interaction made them remember it.
Closing
After judging ended, there was some time before closing ceremonies so that the judges could decide winners for each track. During this time, we mostly hung out, and I once again caught up on sleep. We also spent some time returning the markers to the judge that let us borrow them.
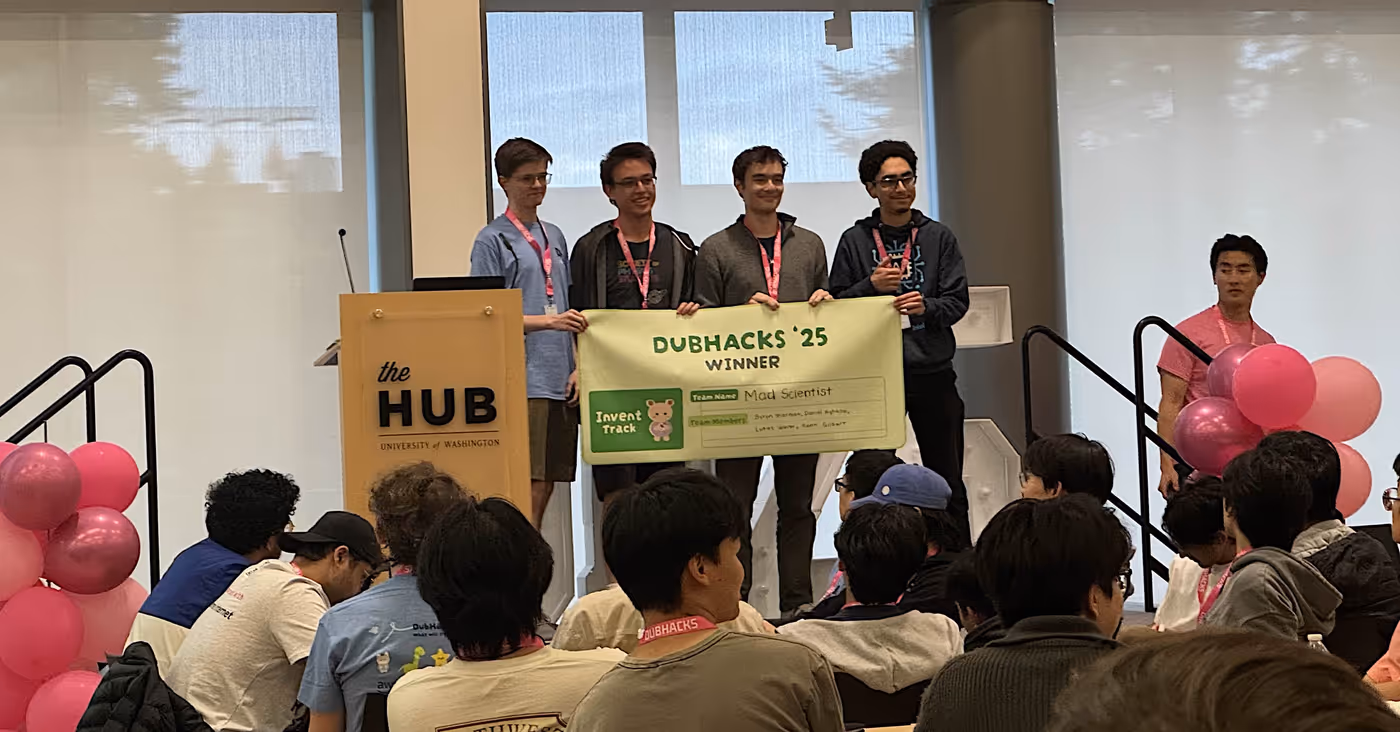
At last, the winners were announced at closing ceremonies. We were first place in the Invent track, one of two main tracks in the hackathon!
This was pretty exciting because I'd never won a hackathon this large before. That said, I don't attend hackathons to win, and our performance didn't change that. I come to hackathons to have a good time. Winning is always nice, but I don't need someone to tell me my project is good in order to enjoy myself. In my mind, we won before closing ceremonies. We won when we had a great time making our project and when we met cool people like the guy who printed our PDF and the judge who lent us his markers. We will continue to win as long as we find the true spirit of a hackathon: the magic of creation, the late-night debugging, the other ultra-nerdy people fate would have us meet, the stroke of genius that only comes when caffeine is substituted for sleep, the sense of achievement when a hard problem is overcome by combining the powers of two brains. That's my kind of winning.
I like winning.
See you here in another few months.